jpadc said:
All true, but my question is based on the fact that there are plenty of '15s here (like OPs) and '13s (like mine also built in late '13) that are not showing as good of stats with far less miles and equally nice climates. It would seem like the LEAF's battery (at least '13s and beyond) acts a bit more like "use it or loose it" which is very different than "cycles bad." All of which makes LeafMuranoDriver's (OP's) crazy sounding thread thread title (this one) seem not so crazy.
I can't speak to "cycles bad" vs. Brian's results and honestly, I haven't followed discussion of SOH vs. Hx vs. actual capacity, as the SOH and Hx values I don't think are well understood.
(Someone correct me if I'm wrong on this, please.)
AFAIK, Nissan hasn't documented any of these values and but we know these values tend to go down over time and are low on cars w/degraded batteries. We also don't know what Nissan intended these numbers to represent along w/how their accuracy, precision, error range, caveats, firmware/algorithm bugs, etc. Hell, for all we know, they might internally document one or both of these as buggy or to ignore, or they're only valid in certain conditions (e.g. temp range, mileage, etc.) or after a certain set of events has passed (e.g. x # of cycles from 100% down to xx%).
Not to go too OT, for ICEV emissions tests, in states that do them and check via OBD2 port, a readiness flag has to be set (see "Readiness Flags" under http://www.autotap.com/techlibrary/obdii_and_emissions_testing.asp, for example). http://www.toyotapart.com/READINESS_MONITOR_DRIVE_PATTERNS_T-EG02-003.pdf has examples of the quickest method to trigger the tests and thus reach smog test ready state.
To quote from a PDF copy of the manual I got from Turbo3, which should be the same as what's in the app's help.
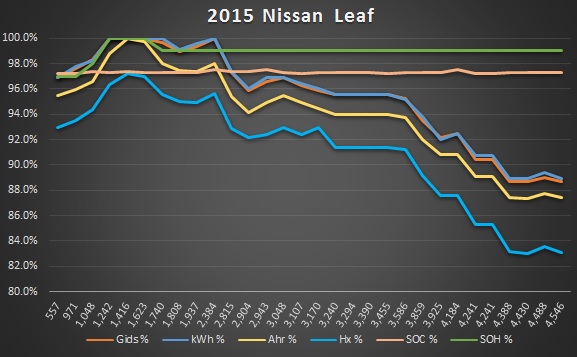
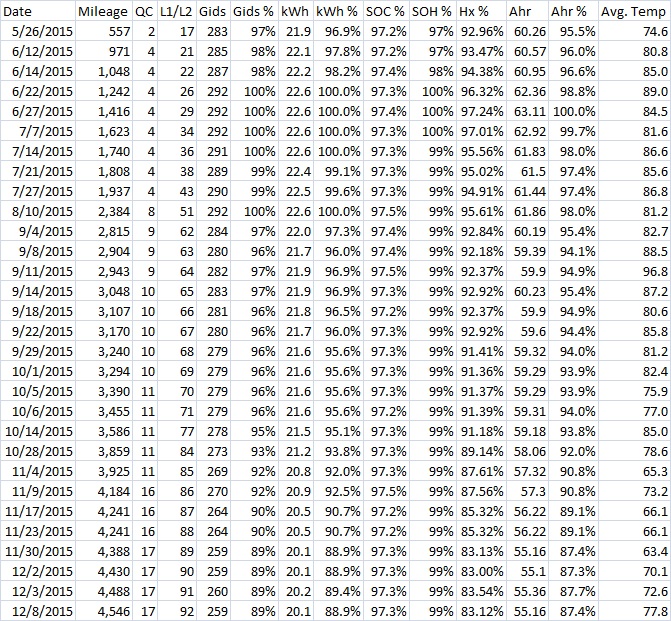
SOH State of Health is another indication of the battery's ability to hold and release energy and is reported as a percentage. When the battery is new SOH=100%. When SOH drops to 85% for a month or so the Leaf loses the first capacity level segment displayed on the right side of the Leaf's central dash display. The capacity gauge is the rightmost outer curved column of segments next to "1" at the top and "0" at the bottom with the last two segments being colored red.
...
Hx The meaning of this number is not fully understood but it appears to be inversely related to the battery internal resistance. As the internal resistance of the battery pack increases it is thought this percentage decreases. As internal resistance increases more energy is lost within the pack and the pack heats up more under load.
For all we know, Brian's climate + current driving habits (e.g. presumably very long trips w/cycles from 100% to almost dead, rinse and repeat) has made these numbers go up but his actual capacity is significantly worse than what the numbers lead us to believe.
On one of the Facebook threads, one guy asserted that long trips tend to make these value rise. This was news to me, since I don't track discussion of Hx and SOH. And, for all we know, those of us who have shallow discharges may have "invalid" values or ones that are known to be off by x due to shallow discharges.
It'd be interesting to know how correlated these are w/actual battery capacities via a discharge test esp. on 2 cars of almost identical age, identical climates but treated differently (short vs. long drives) and one w/much better SOH and Hx numbers than the other, like what the guys at http://avt.inel.gov/fsev.shtml do (e.g. look for battery testing + what's under 2012 Leaf). I doubt we'll ever know since they don't use Leaf Spy, AFAIK.
All we have now are values that Nissan puts on the CAN bus that the BMS/battery controller advertises/responds with.


")