Hello I have a 2 part question:
1) I'm considering purchasing a 2017 Leaf with 55K miles. I connected Leaf Spy lite and learned the Hx = 32.26%. The car has 8 out of 12 bars battery capacity. Would a deep discharge and slow charge help anything with the battery health? Can it help HX? Is there any way to increase HX without replacing or repairing the battery? (Leafspy image attached, feedback welcome)
2) Can I replace the 2017 30KWH with a healthier 24KWH battery from my rear ended 2015?
Thanks in advance for any input.
-Bill

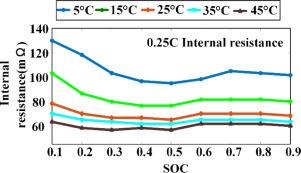
") ). Everyone knows that increasing resistance is the result of aging, that metrics like Hx are related to that, and that Hx will vary inversely with respect to resistance.
). Everyone knows that increasing resistance is the result of aging, that metrics like Hx are related to that, and that Hx will vary inversely with respect to resistance.