Boomer23 said:
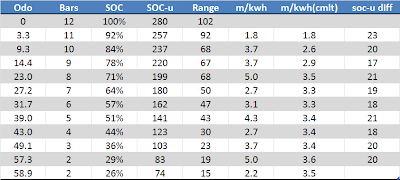
New report on a freeway drive today, total distance 58.9 miles, ran the "tank" down to 2 bars. I ran at normal freeway speeds, sometimes up to 74 mph, got on and off the freeway for safe data recording at times, up and down some hills, A/C on the whole time, ambient temps around 74 F. I took SOC readings immediately as the bars dropped to the indicated bar level.
Main dash energy economy for this trip = 3.5 mi/kWh
Odo miles...Bars...SOC%...SOC #...Guessometer miles
....0...........12.....100%.....280........102
...3.3..........11.....92%......257........92
...9.3..........10.....84%......237........68
...14.4..........9.....78%......220........67
...23.0..........8.....71%......199........68
...27.2..........7.....64%......180........50
...31.7..........6.....57%......162........47
...39.0..........5.....51%......141........43
...43.0..........4.....44%......123........30
...49.1..........3.....36%......103........23
...57.3..........2.....29%.......83.........19
Car Parked, trip end
...58.9..........2.....26%.......74..........15
Edit: After several hours of sitting,
...58.9...........1....25%.......70..........14
I made another run today using the same hardware and software. This run was all fairly flat freeway, speeds in high 60s from Rt 405 in Irvine up to Rt 605 to Cerritos HTB. The return trip was partially on city streets at slower speeds, with the majority of the return trip on the same flat freeways. The day ended with some family errands.
The take-home message is that the results of the SOC% and SOC# at the point of each bar drop are almost identical to the first run that I did. The terrain and speeds were different, but the bars vs. SOC were the same. This is as we would expect, I think.
Some detail: I chose not to record Guessometer readings. They aren't much use, and I wanted to reduce the amount of data that I was recording while I drove. Secondly, after my arrival at my first destination, I got out of the car and turned it off, disconnecting the SOC gauge for a 3 hour breakfast meet up. When I started the car again, the indicated 7 bars had dropped to 6 remaining. (This has happened to me before, losing a bar just by stopping and starting the car. Gary has a theory that it has something to do with the way the bars display works, hysteresis, something.) Then I made a 9.3 mile trip at low speeds, without losing a bar. I parked the car again and when I turned it back on, it had lost one more bar, now down to 6 bars. So the SOC readings that I took were upon re-starting the car, but not upon losing a bar during continuous driving.
Also, I missed recording the drop from 5 to 4 bars. What, do you think this stuff is easy, while driving down the freeway??? :lol:
And the remaining readings were taken after numerous starts and stops on family errands. So these were also less precise readings.
All of that said, though, the readings match up darn well with the previous run.
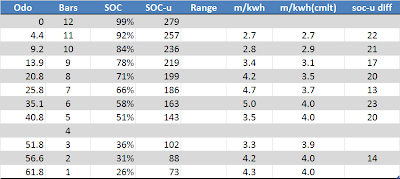
Average mi/kWh efficiency from main dash: 4.0 mi/kWh for this run
Odo miles...Bars...SOC%...SOC#
..0.............12.....99........279
..4.4...........11.....92........257
..9.2...........10.....84........236
..13.9...........9.....78........219
..20.8...........8.....71........199
..25.8...........7.....66........186
..35.1...........6.....58........163
..40.8...........5.....51........143
..Data Missed..4....................
..51.8............3.....36........102
..56.6............2.....31.........88
..61.8............1.....26.........73