Optimal Portion of Battery to Use for Longest Battery Life?

My Nissan Leaf Forum

Help Support My Nissan Leaf Forum:

This site may earn a commission from merchant affiliate links, including eBay, Amazon, and others.
JPWhite said:
Is there any mention of what the temperature bars represent in terms of actually temperature. Is the scale linear per bar or not?
I found this from another thread:
bt2.jpg
[/quote]

JPWhite said:
Last night I noticed the temp gauge had one more bar than normal, still well within the gauges normal zone, but it would be good to know how much extra heat that bar represents. Yesterday was a hot one here in Tennessee.
Seeing 7 bars is the norm for us here in AZ summer heat. I've never seen 8 bars, however.
 
Stoaty said:
But 40% is about 5 bars (assuming only 12 bars). If you count two "hidden bars" then 40% would about 6 bars (6/14 = 42%).
Yes, that's a great point. There is strong consensus that Nissan does not show us the full capacity on the battery gauge. I should have said 3 to 10 bars, because based on what I believe to be true, that most likely corresponds to the 40% to 80% SOC range.

This is speculative and we don't have consensus on it, but think of the rated battery capacity in terms of 16 bars. Only 12 bars are shown on the gauge, 2 additional bars serve as reserve before hitting turtle and the rest are silent and not accessible. If this model were close to reality, 3 bars would roughly correspond to 37% SOC.
 
Stoaty said:
But 40% is about 5 bars (assuming only 12 bars). If you count two "hidden bars" then 40% would about 6 bars (6/14 = 42%).
Oops, I went in the wrong direction on that last one. If there are actually 14 bars, then 6/14 would be about 40%. However, since two of those bars are hidden, that should be 4 visible bars left for 40%.
 
JPWhite said:
Is there any mention of what the temperature bars represent in terms of actually temperature. Is the scale linear per bar or not?

I don't know that I found that, but there is a chart to correspond ohms to temperature.

You could just plug your ohm meter in to measure temp!!!
 
DurkaDurka said:
Tony, the service manual if you have, is it in PDF format? Is if 2011 or 2012? And can you post it? :)

Post the WHOLE service manual? No.

It is in PDF.

Nissan will be happy to let you download a copy for $20. I suspect that the April 2011 revision covers both 2011 and 2012.

Tony
 
Tony,

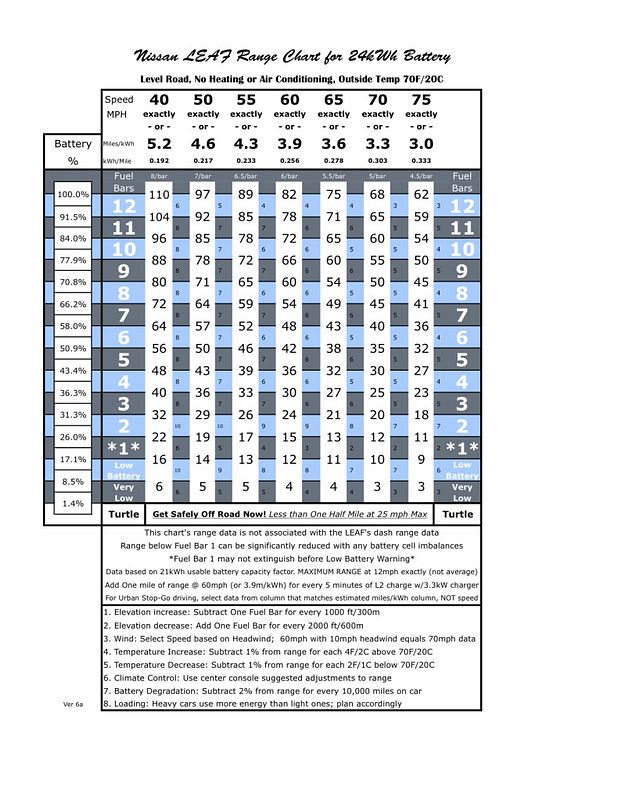
I really like this revision of your chart, but it would be nice if you could include higher miles/KWh readings. For instance, I am getting 5.8 miles per KWh. This chart doesn't tell me how much I have left given a certain number of bars showing.
 
A very easy way that works for almost everything and requires no chart is to simply multiple your M/KwH by 1.5 and then multiple that number by the number of bars you have showing plus two (for the two hidden bars). This will give you a close approximation of your miles remaining.

Stoaty said:
I really like this revision of your chart, but it would be nice if you could include higher miles/KWh readings. For instance, I am getting 5.8 miles per KWh. This chart doesn't tell me how much I have left given a certain number of bars showing.
 
Stoaty said:
If there are actually 14 bars, then 6/14 would be about 40%. However, since two of those bars are hidden, that should be 4 visible bars left for 40%.
I think 2 to 10 bars are easy to remember, especially since the bottom bars are marked red. That should be a good conservative cycle. We have only speculative estimates anyway, and can't be certain the hassle of doing all this is really worth it.
 
TonyWilliams said:
DurkaDurka said:
Tony, the service manual if you have, is it in PDF format? Is if 2011 or 2012? And can you post it? :)

Post the WHOLE service manual? No.

It is in PDF.

Nissan will be happy to let you download a copy for $20. I suspect that the April 2011 revision covers both 2011 and 2012.

Tony

I found the site where you can get it (it's actually subscription based, so I have to wonder if you are allowed to keep it). It only lists 2011, not 2012. Does the manual you have make mention of a battery heater? That would indicate it also covers 2012.

-Alex
 
DurkaDurka said:
Does the manual you have make mention of a battery heater? That would indicate it also covers 2012.

-Alex

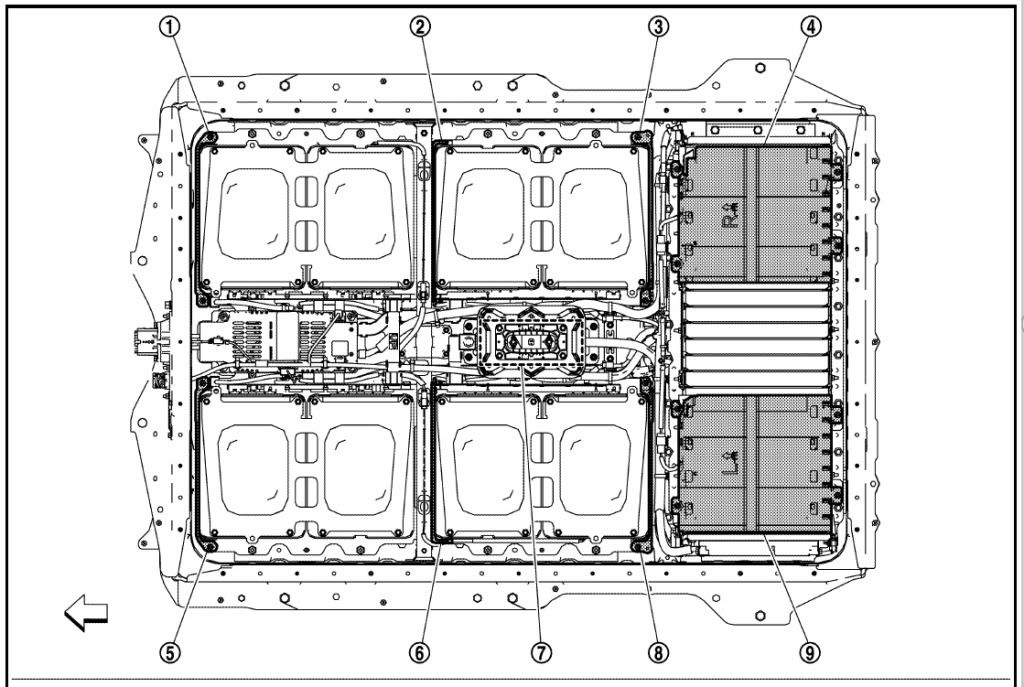
Alex, I posted a diagram of the battery heaters in the battery pack, just a few posts up, and reposted below. Eight heaters, one controller, labeled one through nine in the diagram.

Label 7 is the heater controller.

This is the latest revision, April 2011.

LEAFbatteryHeaters.jpg
 
surfingslovak said:
ericsf said:
LOL. I am sure NASA has a paper about that too.
Speaking of which, one of the two rovers, Opportunity, is still going strong eight years after landing. How is that for battery life?


The batteries on the Hubble Space Telescope are even more impressive after 18 years of 90 minute cycles.

http://www.nasa.gov/mission_pages/hubble/servicing/SM4/main/Battery_FS_HTML.html" onclick="window.open(this.href);return false;
 
I came across some interesting information from Charles Whalen on gm-volt.com:

"Temperature has a much greater effect on battery life than SOC. SOC does have an effect, but in the opposite direction of what you might think. For lithium batteries -- and *only* for lithium batteries (this does not apply to NiMH and lead-acid) -- a lower average SOC (to a point, down to 30% SOC) over time will result in a longer battery life, and a higher average SOC over time will result in a shorter battery life. "

This fits with the information from http://www.nrel.gov/vehiclesandfuels/energystorage/pdfs/53470.pdf" onclick="window.open(this.href);return false;

Regain 1% capacity at year 8 (extend life by ~6 months) by:

• Reducing charge depletion available energy by 1.5%, or
• Reducing avg. SOC by 5%, or
• Lowering avg. T by 0.5 degrees C
 
Another quote from Charles Whalen:

"Technically, lithium battery calendar life is a function of 4 variables ...

mean (T)
standard deviation (T)
mean SOC
standard deviation (delta SOC)

that varies negatively (inversely) with all 4 of those variables.

The results given in the calendar life graph are for a steady-state, constant temperature T (thus where S.D.(T) = 0) and a steady-state, constant SOC equal to 60% SOC (thus where S.D.(delta SOC) = 0). Well, technically, in such tests the batteries *are* cycled once a month, so I guess it's not strictly speaking a zero S.D.(delta SOC). But the point is that SOC is held constant for 29 days out of the month in the type of testing that the graph given corresponds to. If the average SOC over time is greater than 60% SOC, calendar life will be less than that given in the graph. As the variability of both temperature (S.D.(T)) and the SOC cycling band (S.D.(delta SOC)) increase, calendar life will decrease."

Note: S.D. = standard deviation
 
Stoaty said:
This fits with the information from http://www.nrel.gov/vehiclesandfuels/energystorage/pdfs/53470.pdf" onclick="window.open(this.href);return false;

Regain 1% capacity at year 8 (extend life by ~6 months) by:

• Reducing charge depletion available energy by 1.5%, or
• Reducing avg. SOC by 5%, or
• Lowering avg. T by 0.5 degrees C
Please note that the graphs in that presentation for Phoenix are for a different chemistry than is used in the LEAF and the Volt. According to another graph given by Charles Whalen, the life for the LEAF and Volt battery chemistry is significantly shorter at similar temperatures.
 
RegGuheert said:
According to another graph given by Charles Whalen, the life for the LEAF and Volt battery chemistry is significantly shorter at similar temperatures.
Yes, that report is for Graphite/NCA cells, and the life projections were for PHEVs with 10 and 40 miles range. Obviously, these are are not transferable to the Leaf, and should not be taken at their face value. The projected relative life improvement at lower SOC and lower temperature is only interesting as a point of reference, and from an educational standpoint. It illustrates that these techniques can extend the life of batteries. We don't know how the basic chemistry in the AESC cells has been modified, and what these techniques would do for us. The total win might not be worth the hassle. Charles seems to think that the LiMnO4 calendar life graph he used was appropriate, but he did not quote any source for it. I suspect that you need to use the average annual temperature on that graph, and not the summer highs or something similar. This seems to then yield about 8 years for Phoenix. Coincidentally, that's comparable to the life prediction the report came up with for Graphite/NCA cells in harsh environments. I would read and process all of this information critically, and wouldn't want to jump to any conclusions.
1
 
surfingslovak said:
I suspect that you need to use the average annual temperature on that graph, and not the summer highs or something similar. This seems to then yield about 8 years for Phoenix. Coincidentally, this is comparable to the life prediction the report came up with for Graphite/NCA cells in harsh environments.
Actually, I was using the 82F data from Charles' graph and comparing it to the 28C isothermal results in order to make an apples-to-apples comparison. Charles' data gives a result of just less than 6 years while the isothermal data for the other chemistry indicates a bit over 8 years of life. One thing that is not clear is the capacity loss that Charles Whalen used as the definition for end-of-life. The report used 75% remaining capacity as the target.

Just for others reading this, here is the graph that Charles Whalen posted to which we are referring: Lithium manganese battery calendar life versus temperature.
 
RegGuheert said:
surfingslovak said:
Actually, I was using the 82F data from Charles' graph and comparing it to the 28C isothermal results in order to make an apples-to-apples comparison.
Therein lies the problem, there is no such thing as an apples-to-apples comparison here. If it were this simple, Nissan, Tesla and GM could save themselves considerable R&D costs. The graph Charles referenced on the Volt forum does not have a clear reference, and we can only guess how it should be used. That said, I doubt that 82F should be used for Phoenix. The AESC cells develop very little operational heat, and the battery has a huge thermal mass when compared to the small PHEV battery in the report. I would caution you again not to jump to conclusions and be careful with this data.
 
surfingslovak said:
Personally, I doubt that 82F should be used for Phoenix.
I didn't select the value, but rather duplicated it from the report. Agreed there would be a higher rise in a smaller PHEV.

Charles' data *appears* to be simple degredation without any cycling. It appears that the average temperature in Phoenix is about 75F. I'm sure we can agree that the average temperature of the battery cannot be at or below this value, but rather must be above it. How much above? 7F does not seem unreasonable to me for an average rise above ambient for a commuter car in Phoenix.

It looks like average battery temperatures below about 65F will be required to get a capacity life of more than about 8 years (to some undefined capacity: maybe 70%?). Perhaps we need to ask Charles about his graph...
 
RegGuheert said:
surfingslovak said:
Personally, I doubt that 82F should be used for Phoenix.
I didn't select the value, but rather duplicated it from the report.
Please let's not do that, I'm convinced that the report has very little value for the Leaf.

RegGuheert said:
Agreed there would be a higher rise in a smaller PHEV. Charles' data *appears* to be simple degredation without any cycling. It appears that the average temperature in Phoenix is about 75F. I'm sure we can agree that the average temperature of the battery cannot be at or below this value, but rather must be above it. How much above? 7F does not seem unreasonable to me for an average rise above ambient for a commuter car in Phoenix.
OK, I have about 72F average ambient for Phoenix, AZ, and I believe that typically 70F is used. Hopefully, you are willing to agree that 7F above ambient for the entire life of the vehicle is pure speculation? If the car was parked outside, I believe that it would closer - perhaps 1 or 2F above ambient. The Leaf develops very little operational heat, and spends the vast majority of time just sitting. Not charging and not driving. Let's have the intellectual honesty to admit that these numbers are guesses. They cannot be used to project the life of the pack, and the projections based on them should not be used as reference.
RegGuheert said:
It looks like average battery temperatures below about 65F will be required to get a capacity life of more than about 8 years (to some undefined capacity: maybe 70%?). Perhaps we need to ask Charles about his graph...
Yes, that's a great idea, asking Charles would be much better idea than speculating about this on our own. I'm sorry for being a bit harsh here, but I almost regret bringing references to his work to the forum. It's very easy to get it wrong. We have very little hard data to go by, and wouldn't do anyone a favor by pretending that we knew better. As to the reports from Phoenix, I would wait where the data will lead us.
 
Back
Top