I got my car back from the dealer and was able to reproduce the issue once. As I mentioned in the OP, this is reproducible in ambient temperatures of 30°F and lower. It's now warmed back up until next weekend, at which point I'll be able to do more testing and try to raise some DTCs.
Because I didn't think to record my screen, and I'm interested in visualizing the car behavior over time, I'm working with log data. Below are two cluster plots, the first is a 3-minute stretch of data where I reproduce the issue and invoke turtle mode, and the second a ~13 minute quick-charge session starting at a low SOC.
Forgive the nonsensical figure numbering.
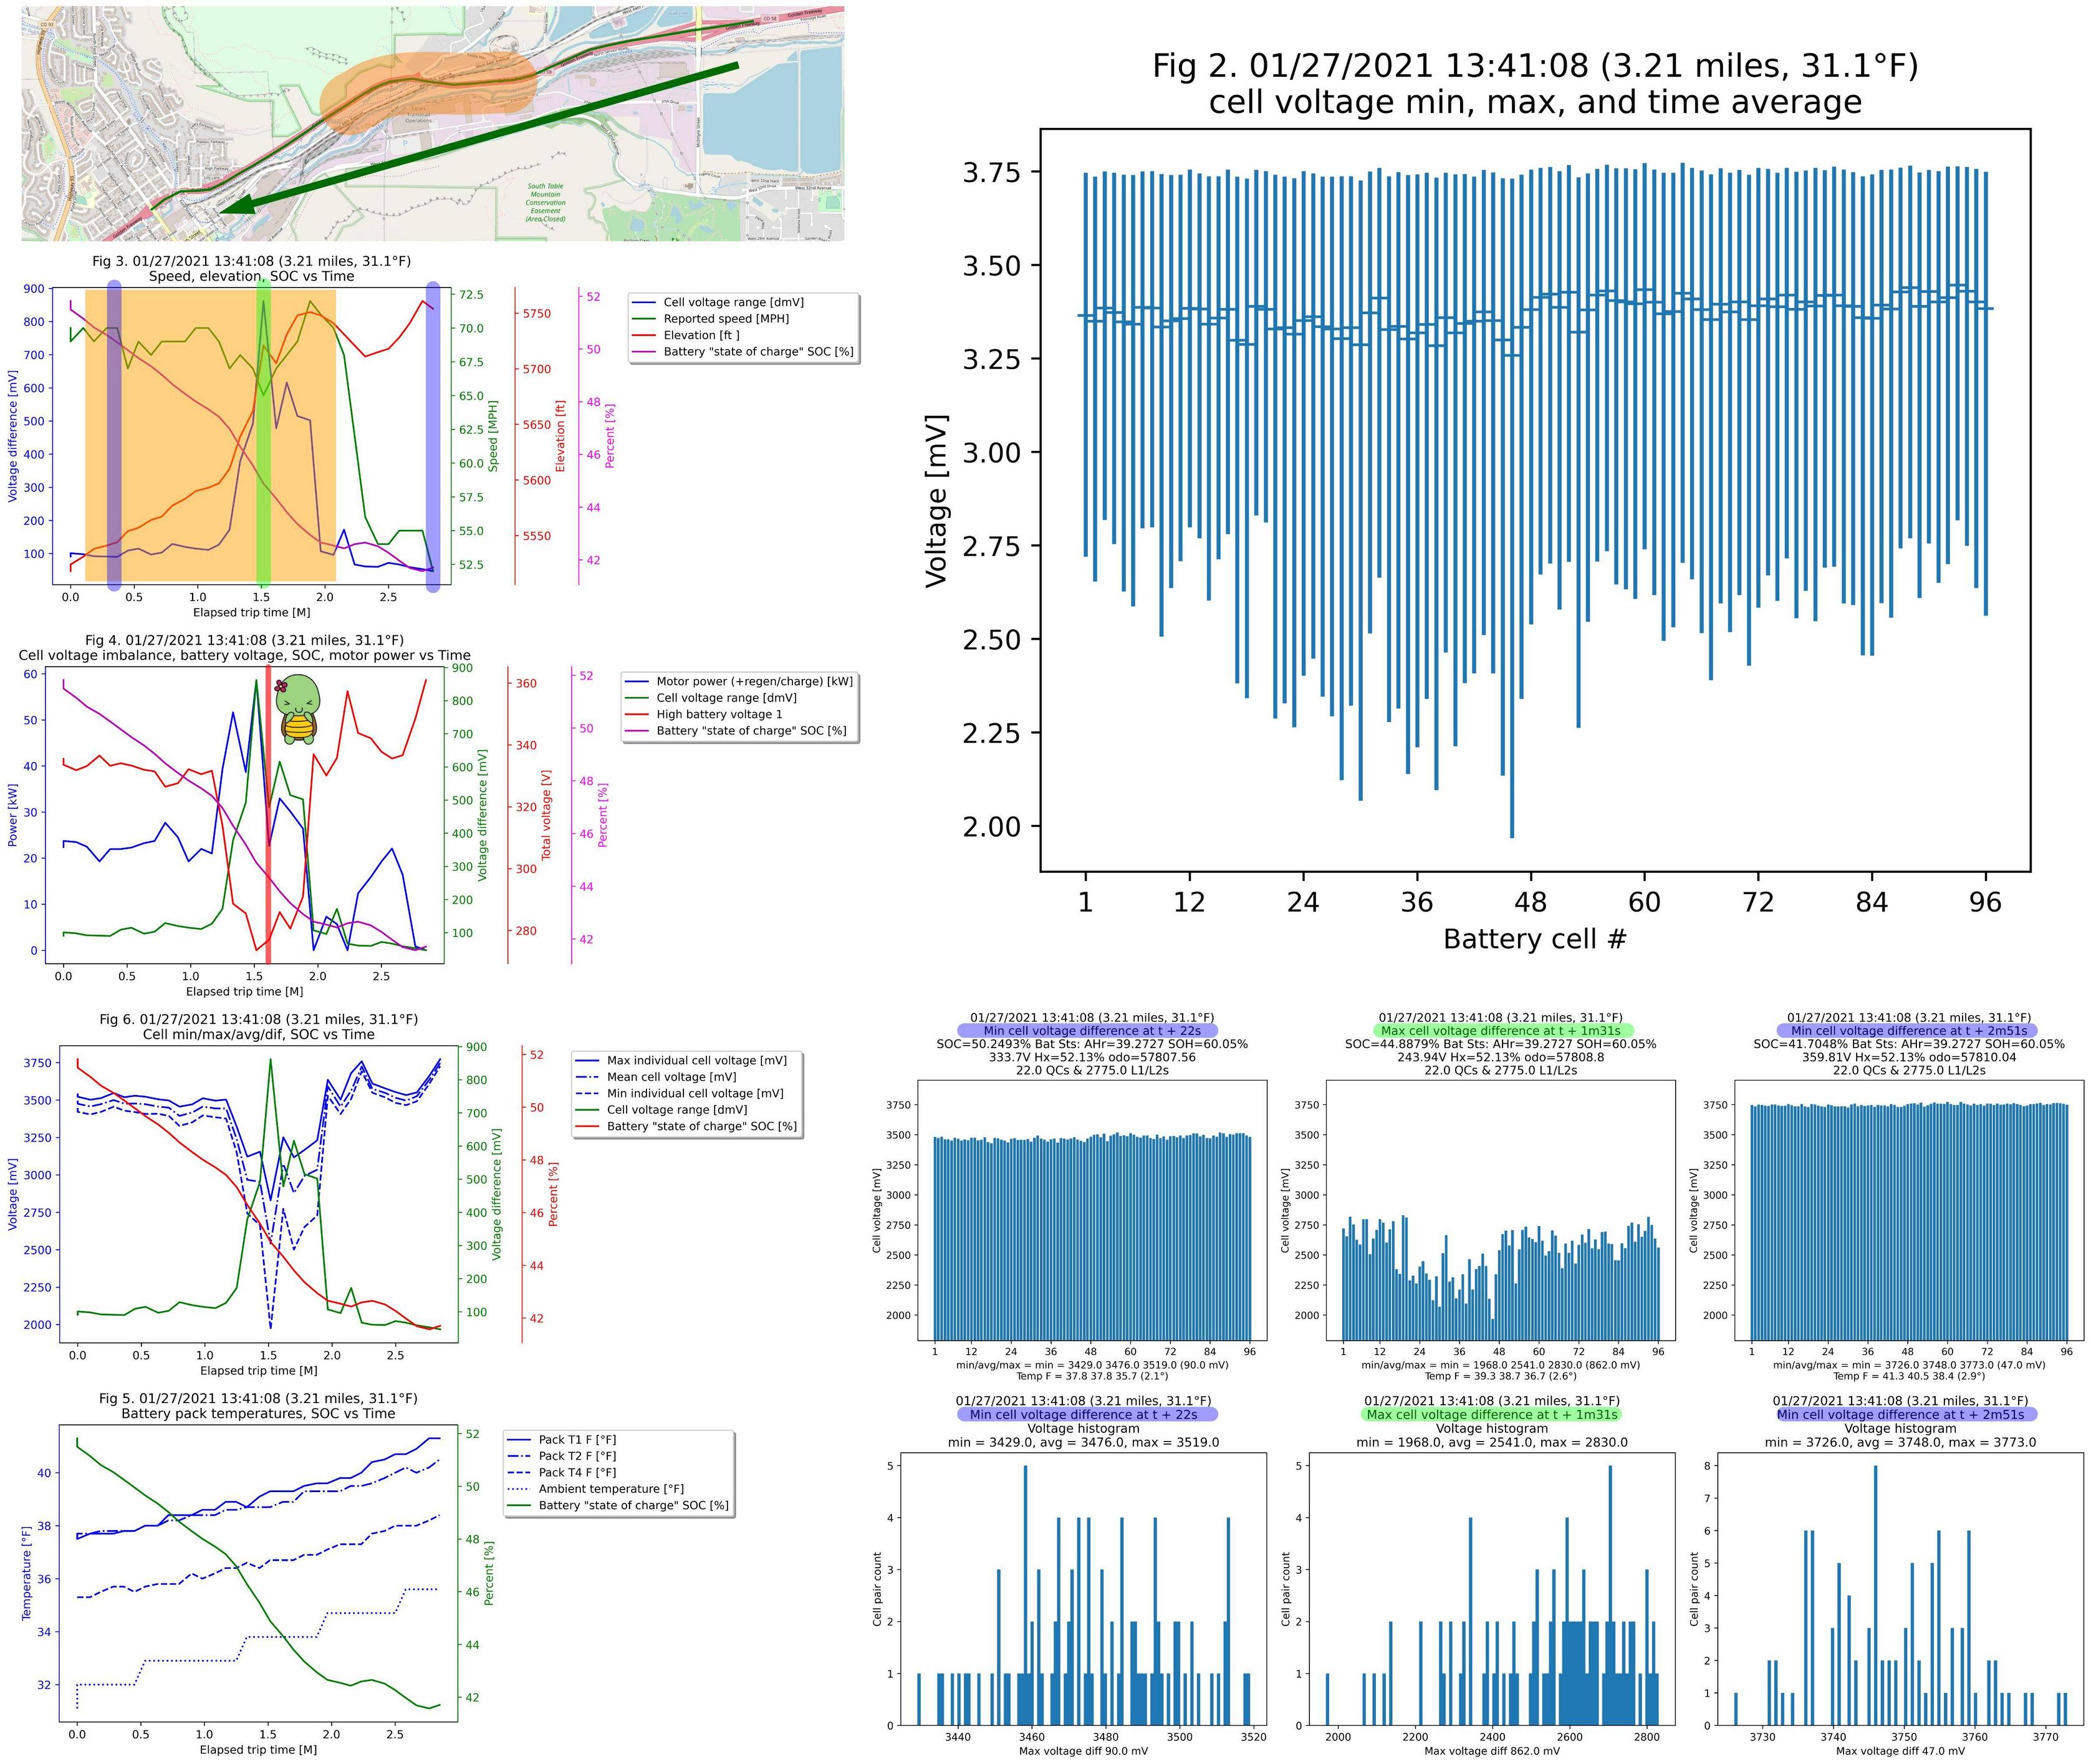
The left column of plots are various bits of data plotted vs time; the title, legend, and lines with color-corresponding axes should make them fairly easy to read.
The right column has at top, the cell min, max, and time average voltages over the duration of the time plots, and below are cell voltage bar charts and histograms at significant times in the data corresponding to max/min cell voltage differences.
No DTCs were thrown during the plotted times, nor were any "Judgement" values calculated.
Turtle mode plot cluster
Here, I'm driving down a stretch of 65MPH highway, from east to west as shown in the map. The orange-shaded stretch (roughly) is up a moderate hill (also shaded in Fig 3). As I go up the hill, and apply 100% throttle, the cell voltage difference starts to climb, and peaks at about 800mV difference at 1.5 minutes. Turtle mode comes on at this point (red vertical line in Fig 4), and you can see the motor power drop at this point, though I'm still applying 100% throttle.
See in Fig 6 that the max cell voltage difference corresponds to a drop of the lowest cell to 2V, which is ridiculously low, but this low voltage isn't an outlier, and the average cell voltage line is nearly halfway between the min and max voltage difference lines. This can be seen as well in the three pairs of bar charts and histograms corresponding to the min and max cell voltage difference time points (blue and green shaded lines in Fig 3 respectively). The center (green shaded) cell voltage histogram that corresponds to the max voltage difference shows that the voltage difference is spread somewhat evenly across the cells. I suppose you could list bad cells in order of lowest voltage (those close to 2V).
I can't believe this didn't throw a DTC, but perhaps the quick-charge plots below will make more sense of this.
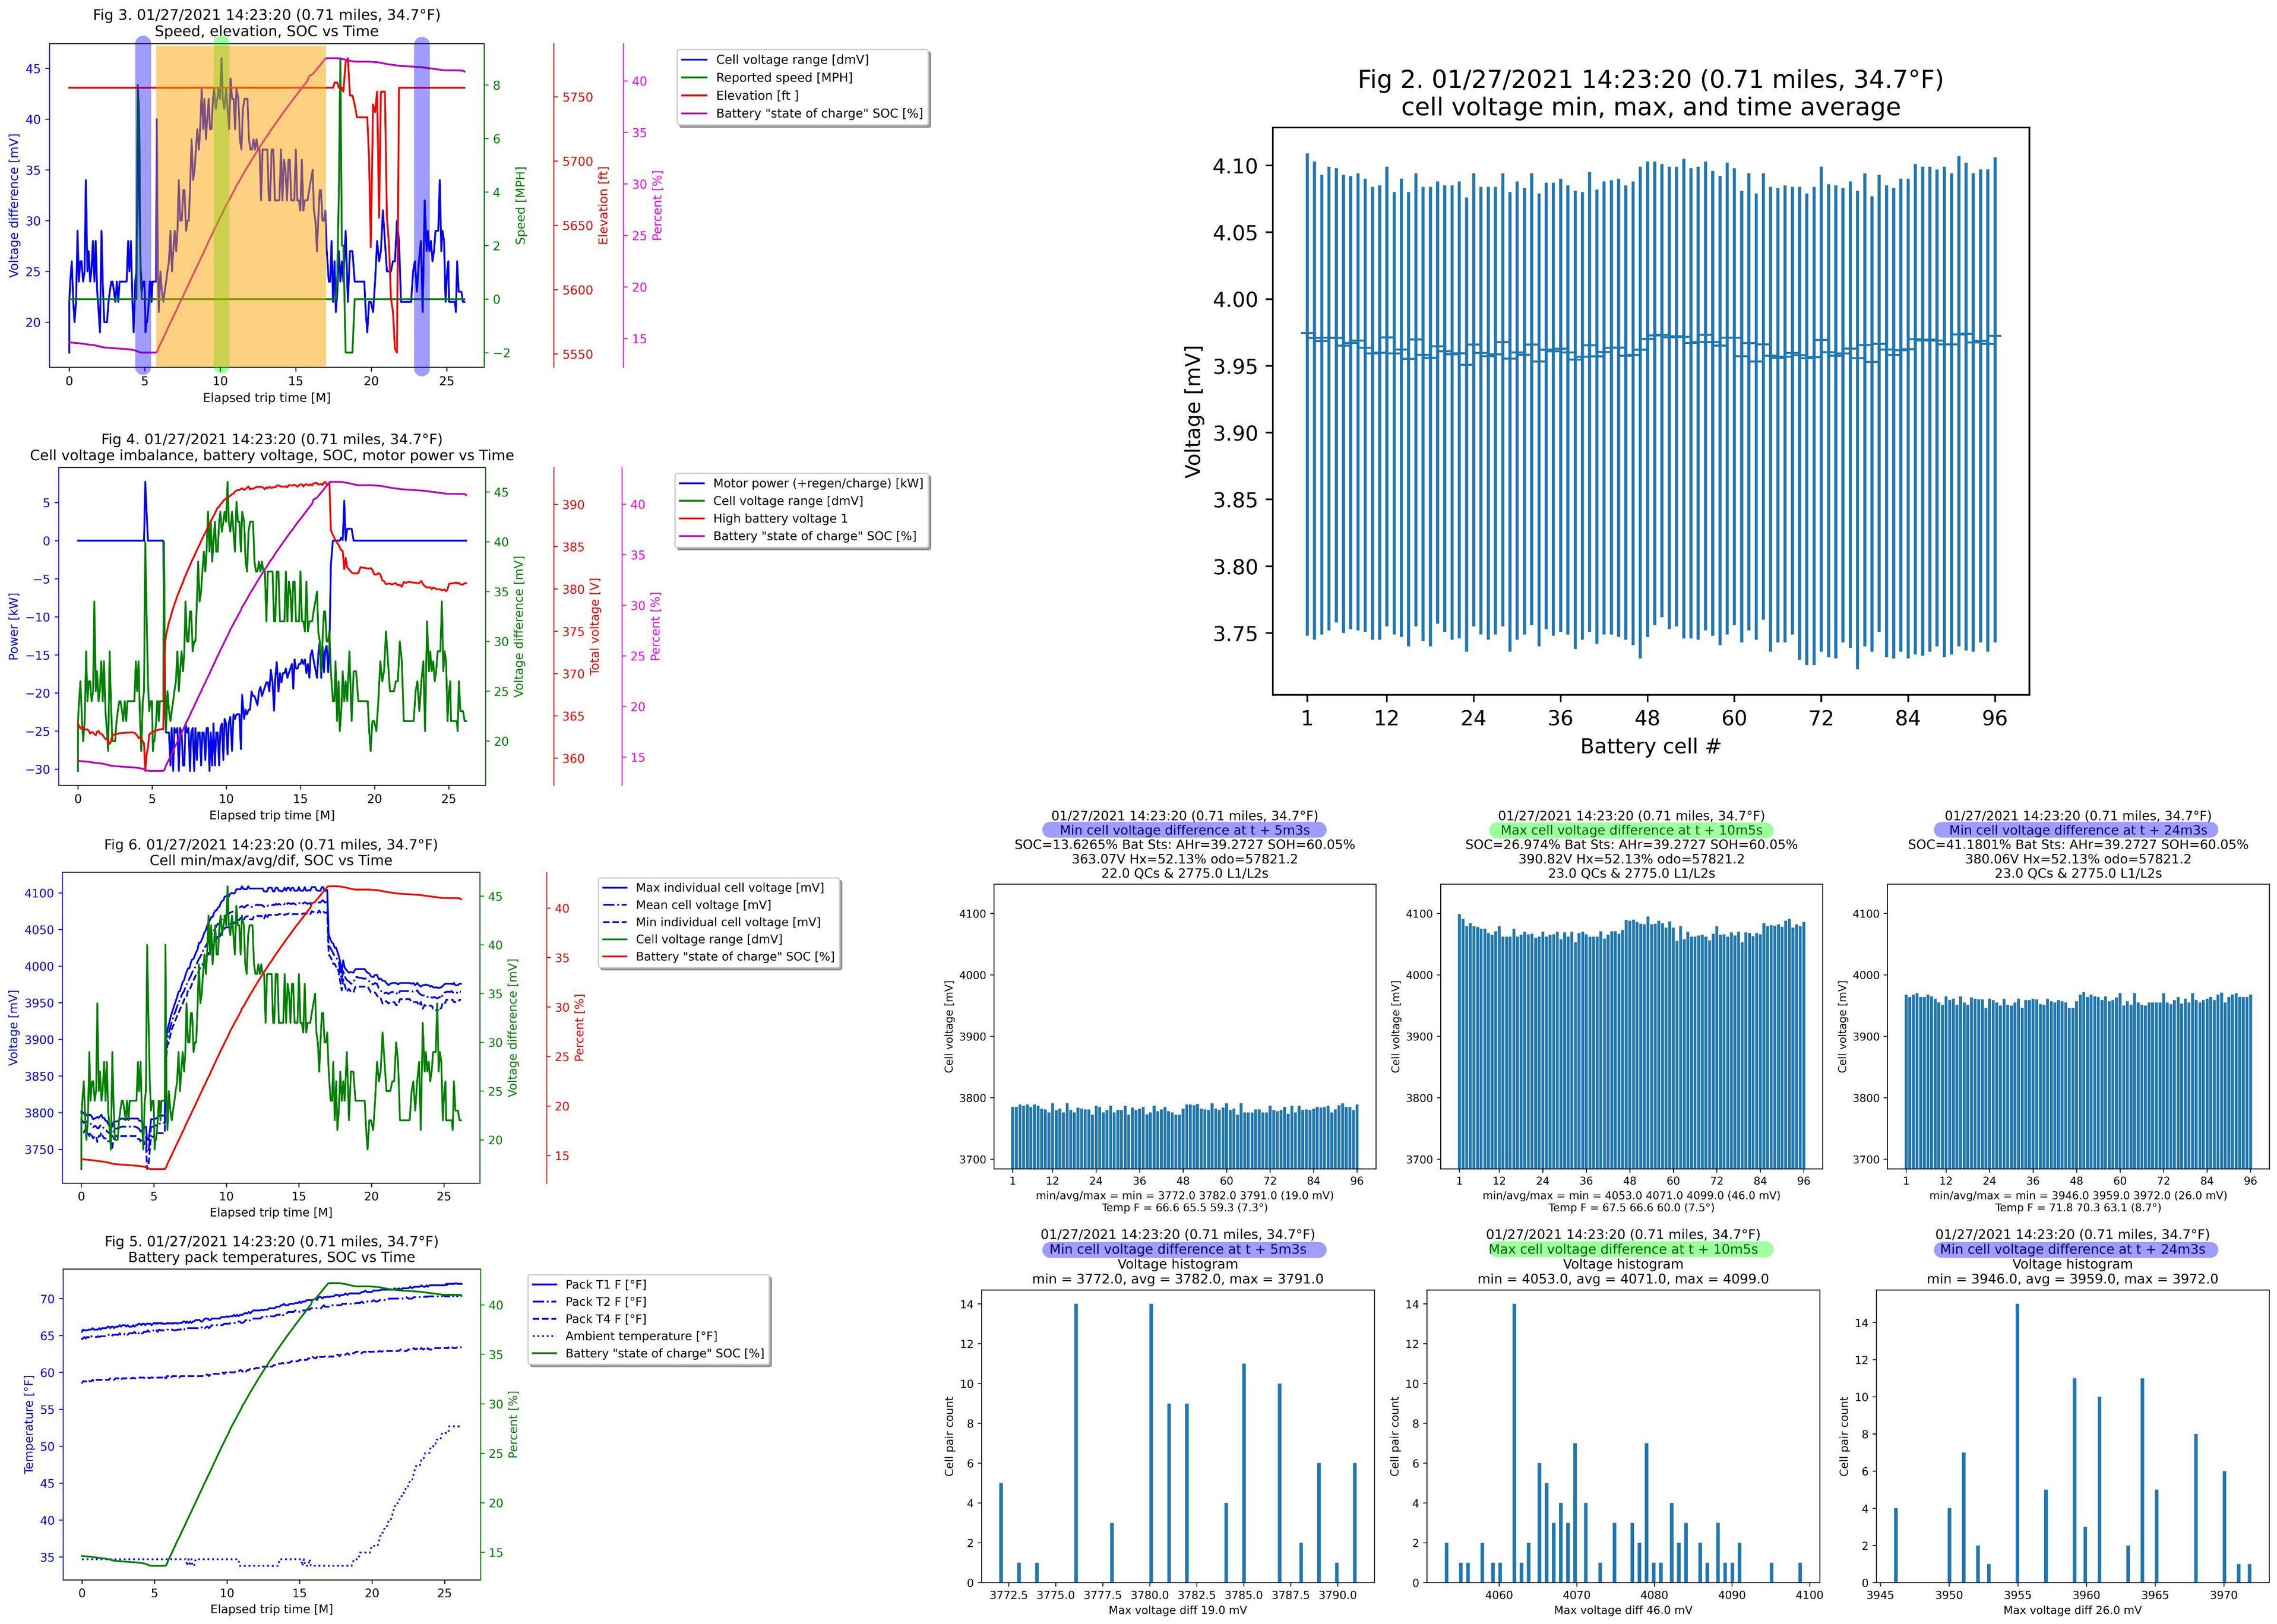
Quick-charge from 7% charge plot cluster
This one's simpler, and same plots as above. I drove around to get to where the car was reporting 7% remaining charge.
Time 0 to ~6 minutes I had been intending to follow the instructions for a cell voltage loss inspection (on EVB-161), but the dealer put my dashboard back incorrectly such that I wasn't able to set it to full heat. Regardless, during this time the max cell voltage difference was around 35mV, and I didn't see the dropoff in voltage from one or more clearly "bad" cells that I had expected to see; they all drop together.
Likewise, during quick-charging the max cell voltage difference increses from ~25mV at idle, smoothly ramping up to a peak of ~45mV. The car never charged faster than 30kW, (though it was a 50kW charger and I expected a full 50kW based on the below plot from https://support.fastned.nl/hc/en-gb/articles/204784998-Charging-with-a-Nissan-Leaf-e-or-e-NV200). The charge starts throttling at about the 10 minute mark, which is at a SOC of ~25% which is where the below plot anticipates it should. This results in the corresponding decrease in cell voltage difference, though I suspect that had the charge not throttled the cell voltage would have continued to climb.
In Fig 2 you can see that the same culprit cells from the tutle-mode case are responsible for the lowest of the low voltage values, however here they don't achieve anywhere near the same voltage difference.
Why no DTCs?
I'll hazard a guess that voltage imbalance DTCs don't throw under high-load, and instead require a rather more smooth and controlled set of conditions such that those described on EVB-161.