If anybody is interested in plotting some of data gathered in LeafSpy log files, I've made Octave script. The Octave is open-source program, similar to Matlab. It can be downloaded here:
https://www.gnu.org/software/octave/download.html
The script (*.m) files for reading LeafSpy logs can be get here:
https://mega.nz/#!FlERwIpa!yaq39GmSh4nADaJSsNDvVVs7_Slnjsu8lul7SQWsAuw
Unpack all *.m files into the same directory. When starting Octave, select the "current directory" the same as the one where you put the *.m files.
Then type LeafSpy_UI in command window and press ENTER. The main GUI windows appears where you can choose your preferences.
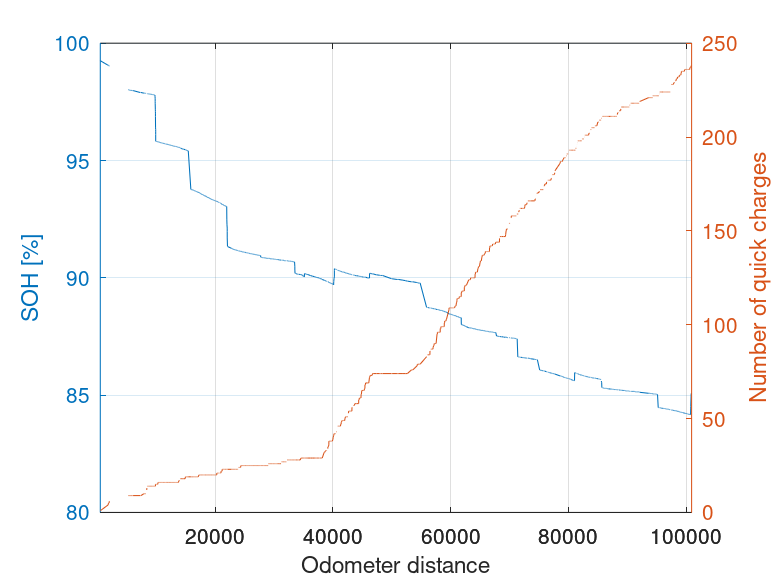
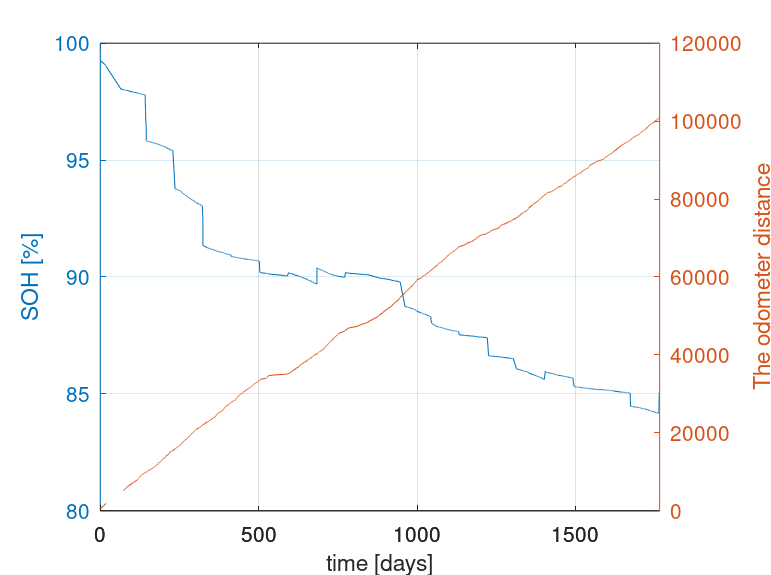
After clicking "Load file and calculate", one of your Log files should be selected. The results are then plotted. Red vertical lines on the graphs (if they appear) represent time gaps in measurements.
See the pdf file for short explanation:
https://docdro.id/2xKJNib
https://www.gnu.org/software/octave/download.html
The script (*.m) files for reading LeafSpy logs can be get here:
https://mega.nz/#!FlERwIpa!yaq39GmSh4nADaJSsNDvVVs7_Slnjsu8lul7SQWsAuw
Unpack all *.m files into the same directory. When starting Octave, select the "current directory" the same as the one where you put the *.m files.
Then type LeafSpy_UI in command window and press ENTER. The main GUI windows appears where you can choose your preferences.
After clicking "Load file and calculate", one of your Log files should be selected. The results are then plotted. Red vertical lines on the graphs (if they appear) represent time gaps in measurements.
See the pdf file for short explanation:
https://docdro.id/2xKJNib