edatoakrun
Well-known member
Ever since TickTock fist suggested the topic of gid variability, the implications of his observations have been setting in.
http://www.mynissanleaf.com/viewtopic.php?f=44&t=9689" onclick="window.open(this.href);return false;
If “gids” do reflect a variable amount of Wh, and they are the values used by the LEAF to calculate kWh use, then the capacity bar displays, dash and nav screen displays of m/kWh, as well as the Carwings calculations based on these same “gid” values, might be expected to be incorrect as well.
I now believe that this quite possibly could be be the case.
I have been noticing an unexplained increase in my dash, nav Screen, and Carwings m/kWh results for a few months now, not only on this test trip, but on other trips, and my long term m/kWh averages.
Before I questioned the accuracies both of the screens and of Carwings, I thought the likely explanations for increased efficiency results, were increased efficiency, in either the driver or vehicle.
I am skeptical of any significant increase in my own driving efficiency, other than that resulting from driving more slowly.
I considered the possibility of increasing vehicle efficiency, and I would not be surprised if drivetrain friction is reduced a bit due to “break-in” of the drivetrain.
But if either of these efficiency factors were improving, I would expect them both to be relatively minor, and self limiting.
This does not seem to be what I am seeing.
I think that my range tests may indicate that whatever method my LEAF uses to calculate kWh, is variable, and has been significantly understating the recent amounts of kWh use, and has probably increasingly inflated all my m/kWh reports, from the dash, nav screen, and CW.
And of course, this could reflect with Tick Tocks observations of variable “gid” Wh values. Gids with higher Wh content could lower the calculated kWh numbers, and raise all the m/kWh results.
Maybe this is what I am seeing, from yesterdays range test. I tried to replicate as accurately as possible, my earliest range test,of almost a year, and almost 10,000 miles ago, to test this hypothesis.
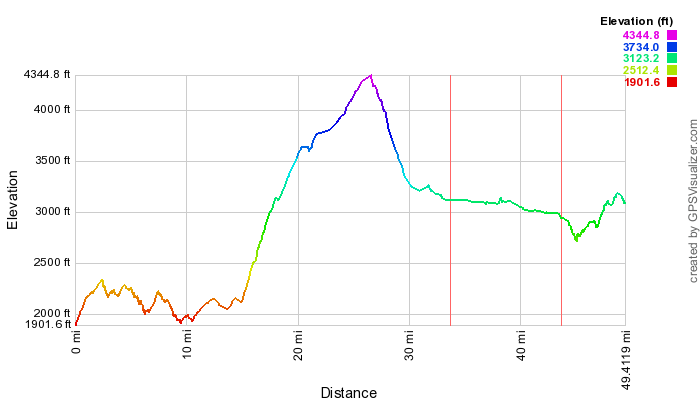
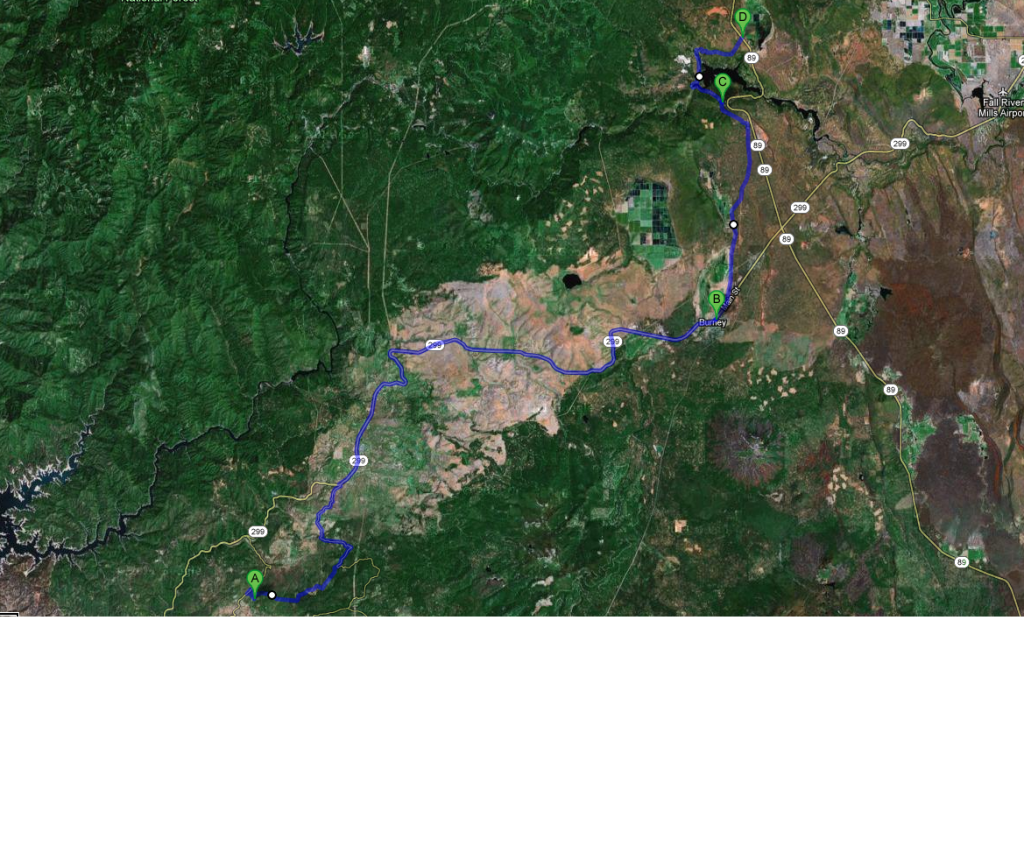
I chose a day with very close to the original temperature condition, and drove the exact same route over the first 87 miles of the trip, using the same mode (eco) and used my original trip logs to closely replicate the same elapsed times for each of the three (same distance) legs of the trip.
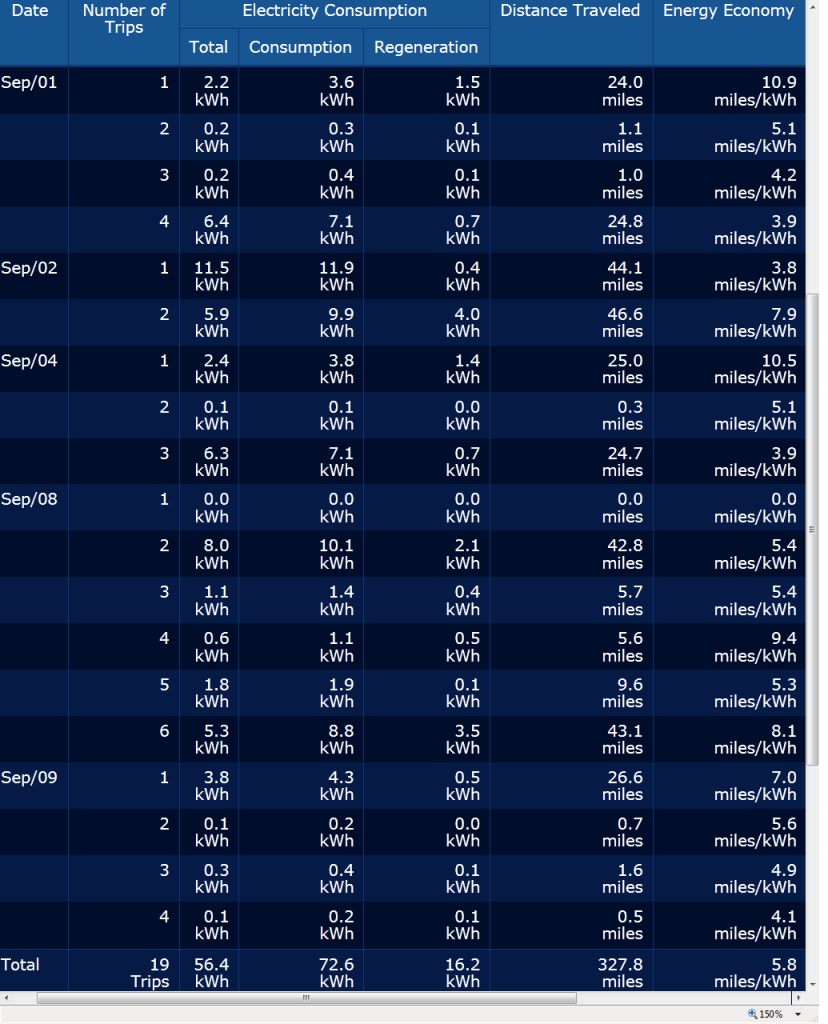
The results from 8/30/12 were:
97.3 miles to VLB, 98.9 miles in total, by the odometer.
CW: 96.5 (~2.5% under-report) total miles, at 5.7 m/kWh, 16.8 kWh used from 100% to about the same capacity level, slightly past VLBW.
Compare this test with my first test on 9/7/11:
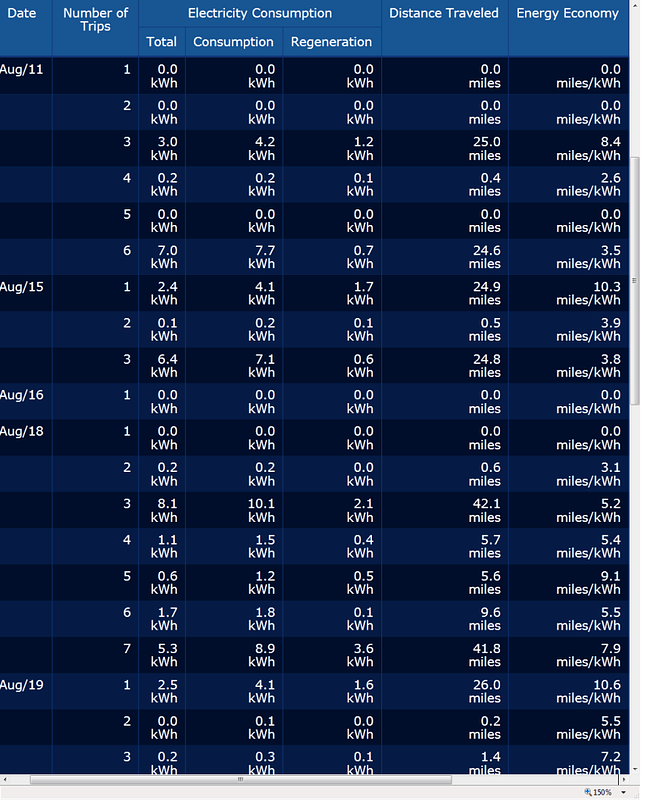
91.5 miles to VLB, 93.4 in total, by the odometer
CW: 91.1 (~2.5% under-report) total miles, at 4.9 m/kWh, 18.7 kWh used from 100% to about the same capacity level, slightly past VLBW.
I do not believe that the slight increase in range over the last year reflects any increase in battery capacity. On the contrary, I expect that my total capacity ( though maybe not the amount of kWh that the BMS is allowing me to access) has declined by an undetermined amount, but it cannot be detected due to the “noise” of uncontrolled variables in a range test.
But I think the decrease of over 10% of reported kWh use, is simply too great to be consistent.
And for those who doubt CW accuracy or consistency, in calculating that total, I’d point out each of the replicated legs of this trip, and of half a dozen other trips I’ve monitored this month, match the m/kWh dash reports precisely.
Both are probably incorrect, BTW, but by about the same 2.5% odometer error rate. So if you can’t or won’t use CW, I think the nav screen m/kWh is probably using the correct “miles driven”, and will probably be reasonably accurate as long as you have factory tires with most of their tread.
Neither the dash or Nav screen results will tell you much though, IMO, unless you can pin down what they are using for a “kWh” value. and if you are using a gid count to calculate kWh, I’d suggest again, that you check to see whether TickTock’s findings of gid variability are correct.
I could write pages of details on these tests, and will answer any specific questions about my methodology.
However, I think that the real key to understanding what is going on, is to have multiple reports of range tests, comparing initial and “reduced capacity” batteries, rather than extrapolations based on m/kWh reports, gid counts, or GOM readings.
An alternate, and perhaps an even better way of calculating actual kWh use is by taking “from the wall” measurements. Though you will always have a variable in charge efficiency, you should be able to be able to get a pretty good estimate by either a meter or charge time.
I don’t have a meter, but I do do have my recharge time from 9/7/11 logged, at ~ 4 hours and 25 minutes to “80%”.
Unfortunately, I did not get a charge completed Email this AM (poor cell reception?) so I cant compare the two times. Next time I get to VLB, I will be sure to finish charging while I am awake, and watch for the results.
TickTock
1 gid *mostly* equals 80Wh
http://www.mynissanleaf.com/viewtopic.php?f=44&t=9689" onclick="window.open(this.href);return false;
If “gids” do reflect a variable amount of Wh, and they are the values used by the LEAF to calculate kWh use, then the capacity bar displays, dash and nav screen displays of m/kWh, as well as the Carwings calculations based on these same “gid” values, might be expected to be incorrect as well.
I now believe that this quite possibly could be be the case.
I have been noticing an unexplained increase in my dash, nav Screen, and Carwings m/kWh results for a few months now, not only on this test trip, but on other trips, and my long term m/kWh averages.
Before I questioned the accuracies both of the screens and of Carwings, I thought the likely explanations for increased efficiency results, were increased efficiency, in either the driver or vehicle.
I am skeptical of any significant increase in my own driving efficiency, other than that resulting from driving more slowly.
I considered the possibility of increasing vehicle efficiency, and I would not be surprised if drivetrain friction is reduced a bit due to “break-in” of the drivetrain.
But if either of these efficiency factors were improving, I would expect them both to be relatively minor, and self limiting.
This does not seem to be what I am seeing.
I think that my range tests may indicate that whatever method my LEAF uses to calculate kWh, is variable, and has been significantly understating the recent amounts of kWh use, and has probably increasingly inflated all my m/kWh reports, from the dash, nav screen, and CW.
And of course, this could reflect with Tick Tocks observations of variable “gid” Wh values. Gids with higher Wh content could lower the calculated kWh numbers, and raise all the m/kWh results.
Maybe this is what I am seeing, from yesterdays range test. I tried to replicate as accurately as possible, my earliest range test,of almost a year, and almost 10,000 miles ago, to test this hypothesis.
I chose a day with very close to the original temperature condition, and drove the exact same route over the first 87 miles of the trip, using the same mode (eco) and used my original trip logs to closely replicate the same elapsed times for each of the three (same distance) legs of the trip.
The results from 8/30/12 were:
97.3 miles to VLB, 98.9 miles in total, by the odometer.
CW: 96.5 (~2.5% under-report) total miles, at 5.7 m/kWh, 16.8 kWh used from 100% to about the same capacity level, slightly past VLBW.
Compare this test with my first test on 9/7/11:
91.5 miles to VLB, 93.4 in total, by the odometer
CW: 91.1 (~2.5% under-report) total miles, at 4.9 m/kWh, 18.7 kWh used from 100% to about the same capacity level, slightly past VLBW.
I do not believe that the slight increase in range over the last year reflects any increase in battery capacity. On the contrary, I expect that my total capacity ( though maybe not the amount of kWh that the BMS is allowing me to access) has declined by an undetermined amount, but it cannot be detected due to the “noise” of uncontrolled variables in a range test.
But I think the decrease of over 10% of reported kWh use, is simply too great to be consistent.
And for those who doubt CW accuracy or consistency, in calculating that total, I’d point out each of the replicated legs of this trip, and of half a dozen other trips I’ve monitored this month, match the m/kWh dash reports precisely.
Both are probably incorrect, BTW, but by about the same 2.5% odometer error rate. So if you can’t or won’t use CW, I think the nav screen m/kWh is probably using the correct “miles driven”, and will probably be reasonably accurate as long as you have factory tires with most of their tread.
Neither the dash or Nav screen results will tell you much though, IMO, unless you can pin down what they are using for a “kWh” value. and if you are using a gid count to calculate kWh, I’d suggest again, that you check to see whether TickTock’s findings of gid variability are correct.
I could write pages of details on these tests, and will answer any specific questions about my methodology.
However, I think that the real key to understanding what is going on, is to have multiple reports of range tests, comparing initial and “reduced capacity” batteries, rather than extrapolations based on m/kWh reports, gid counts, or GOM readings.
An alternate, and perhaps an even better way of calculating actual kWh use is by taking “from the wall” measurements. Though you will always have a variable in charge efficiency, you should be able to be able to get a pretty good estimate by either a meter or charge time.
I don’t have a meter, but I do do have my recharge time from 9/7/11 logged, at ~ 4 hours and 25 minutes to “80%”.
Unfortunately, I did not get a charge completed Email this AM (poor cell reception?) so I cant compare the two times. Next time I get to VLB, I will be sure to finish charging while I am awake, and watch for the results.