TonyWilliams
Well-known member
30kWh LEAF Classic:
Use this 100% chart for a new 30kWh battery
Use this chart for a 30kWh battery at 90% capacity
Use this chart for a 30kWh battery at 80% capacity
Use this chart for a 30kWh battery at 70% capacity
METRIC:
METRIC - Use this chart for a 30kWh battery at 100% capacity
METRIC - Use this chart for a 30kWh battery at 90% capacity
METRIC - Use this chart for a 30kWh battery at 80% capacity
METRIC - Use this chart for a 30kWh battery at 70% capacity

60kWh LEAF v2.0
Use this 100% chart for a 60kWh new battery.


Here's how bad the range can get with a seriously degraded battery:
Update: - 9 October 2012, Added chart version "7G". Each PDF file has English (first page) and Metric (second page) measure.
Now for iPhone, iPad, and iPod, free from the Apple App Store
Now for Android !!!
If your LEAF is missing any of the small capacity bar segments of the 12 total capacity segments on the right hand side of the dash, next to the 12 longer energy remaining bars, use the following appropriate chart(s):
Here are the links on Dropbox - no downloading hassle:
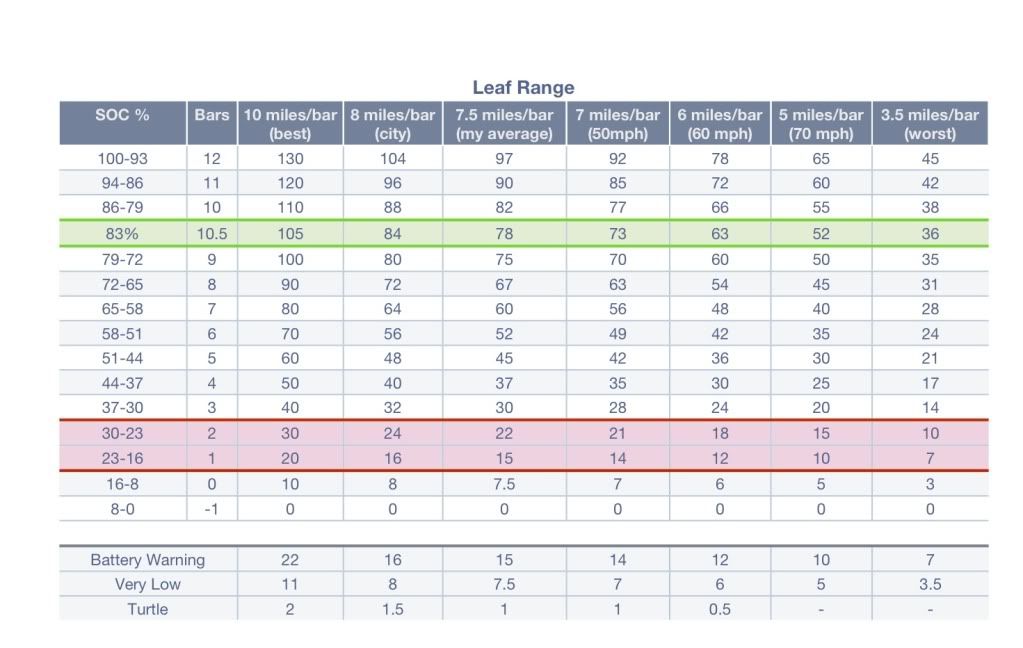
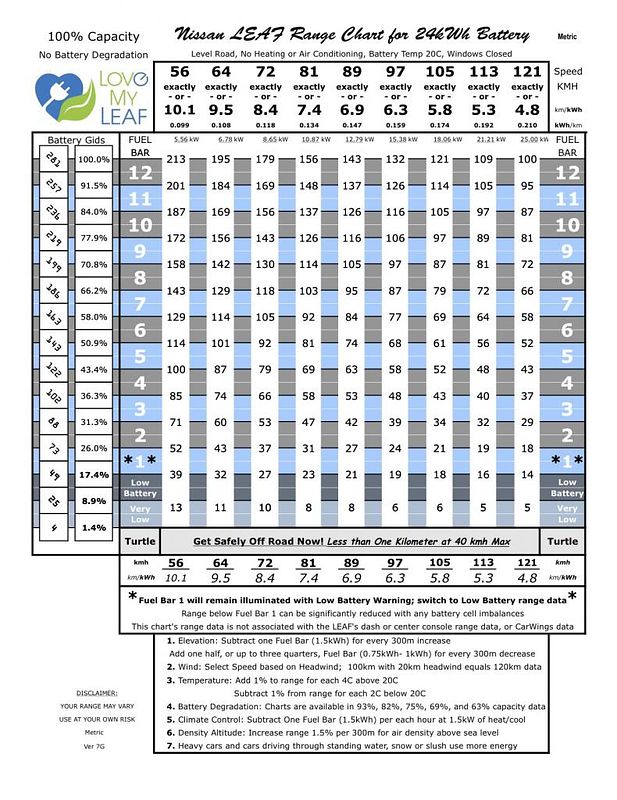
Use this 100% chart for a factory new battery.
Use this 93% chart for a one year old or more battery that still has all 12 capacity bar segments.
Use this 82% chart for a battery that has 11 of 12 capacity bar segments.
Use this 75% chart for a battery that has 10 of 12 capacity bar segments.
Use this 69% chart for a battery that has 9 of 12 capacity bar segments.
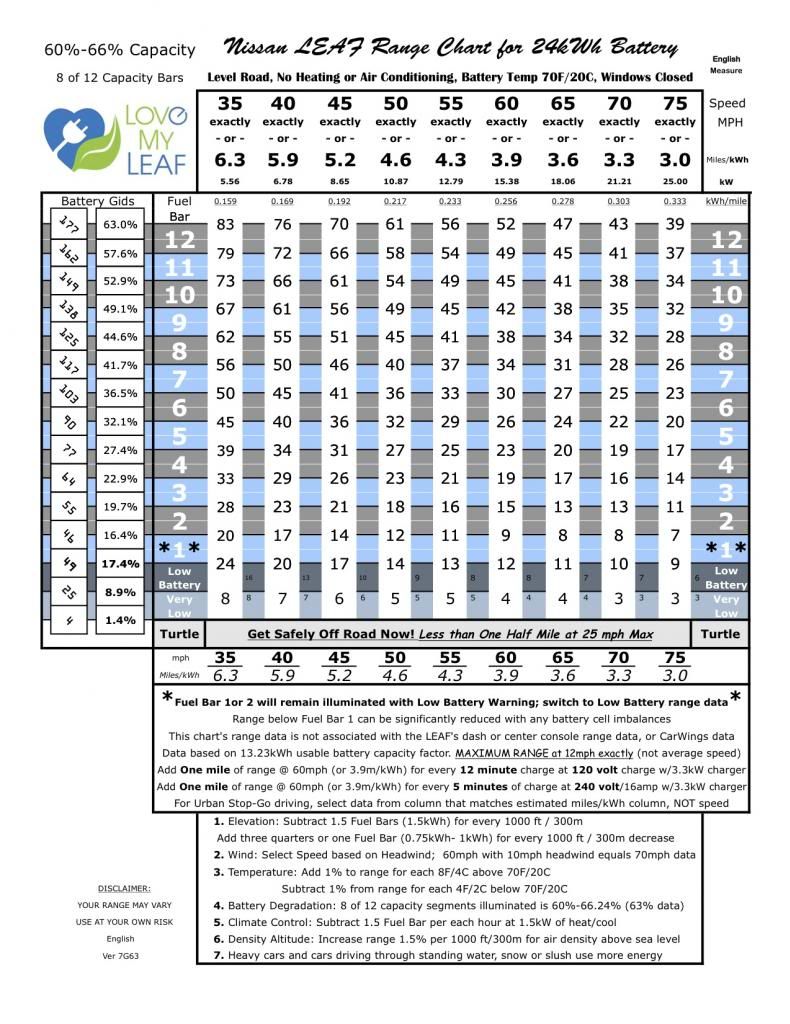
Use this 63% chart for a battery that has 8 of 12 capacity bar segments.
************************
EPA LA4 test cycle: 100 miles
The Nissan LEAF has been tested under the EPA Urban Dynamometer Driving Schedule, a laboratory test commonly called the LA4 test cycle, which represents city driving conditions. Top speed is 56.7 mph and average speed is 19.59 mph. Ambient temperature can vary from 68 - 86 degrees. Climate control is off. The Nissan LEAF easily achieved 100 miles.
************************
If you decide to use this chart, you can print it out and carry it in your car for reference. Your range may vary.
**********************************************************************
MILES GAINED CHARGING
Nissan LEAF Miles Gained per Hour Charging
Amps/Volts -- Where ---- 65mph / 4 miles per kWh consumption rate
12 / 120 ------- Any ------ 4.0 miles (supplied cable with car in USA/Canada)
12 / 208 ------ Public ----- 8.4 miles (EVSEupgrade.com 2011/12 LEAF)
12 / 240 ------ Home ----- 9.6 miles (EVSEupgrade.com 2011/12 LEAF)
16 / 208 ------ Public ----- 11.1 miles (EVSEupgrade.com 2011/12 LEAF)****
16 / 240 ------ Home ----- 12.9 miles (EVSEupgrade.com 2011/12 LEAF)
20 / 208 ------ Public ----- 14.1 miles (Clipper Creek LCS-25)
20 / 240 ------ Home ----- 16.3 miles (Clipper Creek LCS-25)
25 / 208 ------ Public ----- 17.8 miles (EVSEupgrade.com 2013 LEAF)
25 / 240 ------ Home ----- 20.6 miles (EVSEupgrade.com 2013 LEAF)
30 / 208 ------ Public ----- 21.4 miles (unverified at 30 amps**)
30 / 240 ------ Home ----- 22.7 miles (limited to 27.5 amps)
**** will likely pull 18 amps at 208 volts****
**I don't know if its been measured at 200 or 208 volts yet to see if it increases to 30 amps.**
**********************************************************************
TIME USED CHARGING
NOTE: the JESLA portable charge cable from http://www.QuickChargePower.com" onclick="window.open(this.href);return false; can charge any LEAF from the slowest 12 amp to 30 amps using 100 - 250 volts. It can also charge a Tesla Model S, Toyota Rav4 EV, or Mercedes B-Class ED at 10kW (40 amps at 250 volts).
Nissan LEAF hours to charge LEAF with warm new condition battery
From Turtle mode ("dead") to 100%
Amps/Volts -- Where ---- Time
12 / 120 ------- Any ------ 22.8 hours (supplied cable with car in USA/Canada)
12 / 208 ------ Public ----- 11.4 hours (EVSEupgrade.com 2011/12 LEAF)
12 / 240 ------ Home ------ 9.9 hours (EVSEupgrade.com 2011/12 LEAF)
16 / 208 ------ Public ------ 8.6 hours (EVSEupgrade.com 2011/12 LEAF)****
16 / 240 ------ Home ------ 7.4 hours (EVSEupgrade.com 2011/12 LEAF)
20 / 208 ------ Public ------ 6.7 hours (Clipper Creek LCS-25)
20 / 240 ------ Home ------ 5.9 hours (Clipper Creek LCS-25)
25 / 208 ------ Public ------ 5.4 hours (EVSEupgrade.com 2013 LEAF)
25 / 240 ------ Home ------ 4.7 hours (EVSEupgrade.com 2013 LEAF)
30 / 208 ------ Public ------ 4.5 hours (unverified at 30 amps**)
30 / 240 ------ Home ------ 4.2 hours (limited to 27.5 amps)
**** will likely pull 18 amps at 208 volts****
**I don't know if its been measured at 200 or 208 volts yet to see if it increases to 30 amps.**
**************************************************
LEAF Charge-Rate Chart
Assumes 30 amp pilot signal from EVSE
----------- Japan --- USA/Canada - The World --- USA/Canada
Amps --- 200 volts --- 208 volts --- 230 volts ------- 240volts
16 -------- 3.2kW -------- 3.3kW ---- 3.7kW ------ 3.8kW
27.5 ------ 5.5kW** ------ 5.7kW** --- 6.3kW ------ 6.6kW
Obviously, the charger will output some value below those stated above, at about 85-90%. So, a typical LEAF drawing 16 amps at your North American house's 240 volts will put 3.3kW into the battery, and draw 3.8kW from the wall.
The new 2013 LEAF with optional 27.5 amp charger will be about 6.6kW at 240 volts. The 2013 LEAF-S retains the 16 amp charger of all previous LEAFs.
**I don't know if its been measured at 200 or 208 volts yet to see if it increases to 30 amps.**
Use this 100% chart for a new 30kWh battery
Use this chart for a 30kWh battery at 90% capacity
Use this chart for a 30kWh battery at 80% capacity
Use this chart for a 30kWh battery at 70% capacity
METRIC:
METRIC - Use this chart for a 30kWh battery at 100% capacity
METRIC - Use this chart for a 30kWh battery at 90% capacity
METRIC - Use this chart for a 30kWh battery at 80% capacity
METRIC - Use this chart for a 30kWh battery at 70% capacity
60kWh LEAF v2.0
Use this 100% chart for a 60kWh new battery.
Here's how bad the range can get with a seriously degraded battery:
Update: - 9 October 2012, Added chart version "7G". Each PDF file has English (first page) and Metric (second page) measure.
Now for iPhone, iPad, and iPod, free from the Apple App Store
Now for Android !!!
If your LEAF is missing any of the small capacity bar segments of the 12 total capacity segments on the right hand side of the dash, next to the 12 longer energy remaining bars, use the following appropriate chart(s):
Here are the links on Dropbox - no downloading hassle:
Use this 100% chart for a factory new battery.
Use this 93% chart for a one year old or more battery that still has all 12 capacity bar segments.
Use this 82% chart for a battery that has 11 of 12 capacity bar segments.
Use this 75% chart for a battery that has 10 of 12 capacity bar segments.
Use this 69% chart for a battery that has 9 of 12 capacity bar segments.
Use this 63% chart for a battery that has 8 of 12 capacity bar segments.
************************
EPA LA4 test cycle: 100 miles
The Nissan LEAF has been tested under the EPA Urban Dynamometer Driving Schedule, a laboratory test commonly called the LA4 test cycle, which represents city driving conditions. Top speed is 56.7 mph and average speed is 19.59 mph. Ambient temperature can vary from 68 - 86 degrees. Climate control is off. The Nissan LEAF easily achieved 100 miles.
************************
If you decide to use this chart, you can print it out and carry it in your car for reference. Your range may vary.
**********************************************************************
MILES GAINED CHARGING
Nissan LEAF Miles Gained per Hour Charging
Amps/Volts -- Where ---- 65mph / 4 miles per kWh consumption rate
12 / 120 ------- Any ------ 4.0 miles (supplied cable with car in USA/Canada)
12 / 208 ------ Public ----- 8.4 miles (EVSEupgrade.com 2011/12 LEAF)
12 / 240 ------ Home ----- 9.6 miles (EVSEupgrade.com 2011/12 LEAF)
16 / 208 ------ Public ----- 11.1 miles (EVSEupgrade.com 2011/12 LEAF)****
16 / 240 ------ Home ----- 12.9 miles (EVSEupgrade.com 2011/12 LEAF)
20 / 208 ------ Public ----- 14.1 miles (Clipper Creek LCS-25)
20 / 240 ------ Home ----- 16.3 miles (Clipper Creek LCS-25)
25 / 208 ------ Public ----- 17.8 miles (EVSEupgrade.com 2013 LEAF)
25 / 240 ------ Home ----- 20.6 miles (EVSEupgrade.com 2013 LEAF)
30 / 208 ------ Public ----- 21.4 miles (unverified at 30 amps**)
30 / 240 ------ Home ----- 22.7 miles (limited to 27.5 amps)
**** will likely pull 18 amps at 208 volts****
**I don't know if its been measured at 200 or 208 volts yet to see if it increases to 30 amps.**
**********************************************************************
TIME USED CHARGING
NOTE: the JESLA portable charge cable from http://www.QuickChargePower.com" onclick="window.open(this.href);return false; can charge any LEAF from the slowest 12 amp to 30 amps using 100 - 250 volts. It can also charge a Tesla Model S, Toyota Rav4 EV, or Mercedes B-Class ED at 10kW (40 amps at 250 volts).
Nissan LEAF hours to charge LEAF with warm new condition battery
From Turtle mode ("dead") to 100%
Amps/Volts -- Where ---- Time
12 / 120 ------- Any ------ 22.8 hours (supplied cable with car in USA/Canada)
12 / 208 ------ Public ----- 11.4 hours (EVSEupgrade.com 2011/12 LEAF)
12 / 240 ------ Home ------ 9.9 hours (EVSEupgrade.com 2011/12 LEAF)
16 / 208 ------ Public ------ 8.6 hours (EVSEupgrade.com 2011/12 LEAF)****
16 / 240 ------ Home ------ 7.4 hours (EVSEupgrade.com 2011/12 LEAF)
20 / 208 ------ Public ------ 6.7 hours (Clipper Creek LCS-25)
20 / 240 ------ Home ------ 5.9 hours (Clipper Creek LCS-25)
25 / 208 ------ Public ------ 5.4 hours (EVSEupgrade.com 2013 LEAF)
25 / 240 ------ Home ------ 4.7 hours (EVSEupgrade.com 2013 LEAF)
30 / 208 ------ Public ------ 4.5 hours (unverified at 30 amps**)
30 / 240 ------ Home ------ 4.2 hours (limited to 27.5 amps)
**** will likely pull 18 amps at 208 volts****
**I don't know if its been measured at 200 or 208 volts yet to see if it increases to 30 amps.**
**************************************************
LEAF Charge-Rate Chart
Assumes 30 amp pilot signal from EVSE
----------- Japan --- USA/Canada - The World --- USA/Canada
Amps --- 200 volts --- 208 volts --- 230 volts ------- 240volts
16 -------- 3.2kW -------- 3.3kW ---- 3.7kW ------ 3.8kW
27.5 ------ 5.5kW** ------ 5.7kW** --- 6.3kW ------ 6.6kW
Obviously, the charger will output some value below those stated above, at about 85-90%. So, a typical LEAF drawing 16 amps at your North American house's 240 volts will put 3.3kW into the battery, and draw 3.8kW from the wall.
The new 2013 LEAF with optional 27.5 amp charger will be about 6.6kW at 240 volts. The 2013 LEAF-S retains the 16 amp charger of all previous LEAFs.
**I don't know if its been measured at 200 or 208 volts yet to see if it increases to 30 amps.**
")