
AndyH
Well-known member
Excellent chart with four quadrants - Science, Climate Justice, Modernization/Neoliberal, Climate Disinformation/Contrarian.
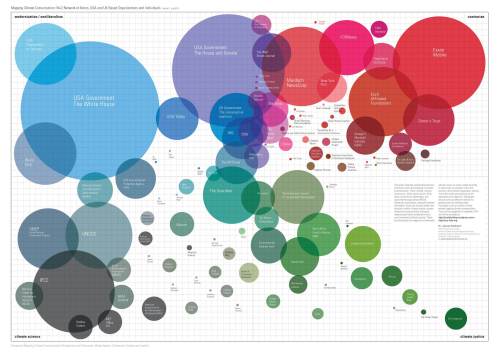
Full size: https://ecolabsblog.files.wordpress...no-2-network-of-actors-july2014-ecolabssm.jpg
Timeline - when did the disinformation start? Who's funding it? What progress has been made in messaging?
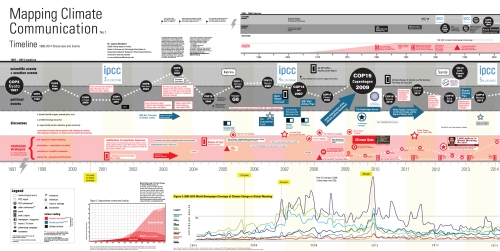
Full:
https://ecolabsblog.files.wordpress...munication-no-1-timeline-july2014-ecolabs.jpg
Discourse strategies
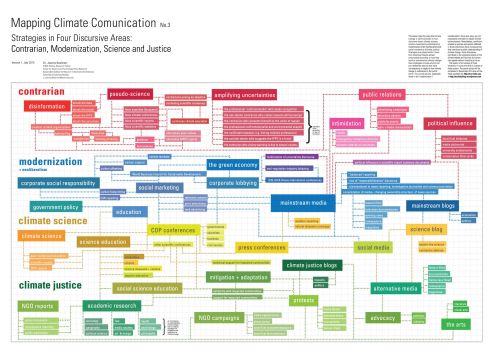
Full: https://ecolabsblog.files.wordpress...ation-no-3-strategies-july2014-ecolabs-sm.jpg
Source:
http://ecolabsblog.wordpress.com/
Full size: https://ecolabsblog.files.wordpress...no-2-network-of-actors-july2014-ecolabssm.jpg
Timeline - when did the disinformation start? Who's funding it? What progress has been made in messaging?
Full:
https://ecolabsblog.files.wordpress...munication-no-1-timeline-july2014-ecolabs.jpg
Discourse strategies
Full: https://ecolabsblog.files.wordpress...ation-no-3-strategies-july2014-ecolabs-sm.jpg
Source:
http://ecolabsblog.wordpress.com/
This series of three posters maps climate communication by means of a timeline, a network visualization and a strategy map. The work illustrates
relationships between climate discourses, prominent actors and major organizations participating in climate communication including science institutions, academic institutions, media organizations, think tanks and government agencies – along with the interests and funders linked to these organizations. Various discourses are mapped including climate science; counter-movements (contrarianism); ecological modernization, neoliberalism and corporate capture; and social movements (climate justice). The timeline visualizes the historical processes that have lead to the growth of various ways of communicating climate change. The network visualization illustrates relationships between actors and prominent discourses. The strategy map displays methods used within four discursive realms.
The posters are still work in process. They will be presented at the ‘Changing Climate Communication’ conference in July 2014. Feedback from this presentation will inform a final stage of the visualizations, to be completed in September 2014.